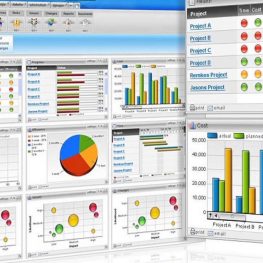
Microsoft Excel has become extremely power tool for any data analyst. Whether you work in Sales, Marketing, Customer Service, Logistics, Accounts, Manufacturing, Finance or Administration, everyone must become an expert at using Microsoft Excel.
It is not sufficient to know Tables & Formulas in Excel. You must also know how to make sense of the data that you have.
Program Outline
Understanding Dashboards
Principles of Great Dashboard Design
Using Advanced Formulas & Functions in Excel
Referencing & Ranges
Advanced Lookup
Advanced Formatting
Advanced Pivot Table Techniques
Percentage
Computed Columns
Grouping & Sorting
Top Views
Multiple data sources
Pivot Charts & VIsual Dashboarding Techniques
Excel-Dashboard to Compare Sales – Training Example
Advanced Power Charting Techniques
Dashboard Macros
Creating Dynamic Dashboards with Excel
Creating a Sales Dashboard
Target Audience
Sales, Marketing, Finance, IT Executives, Engineers, Project Managers, Directors, CXOs, Managing Directors, General Managers, and Data Analysts who dabble with data and want to learn advanced techniques to convert Data into actionable Information.

